







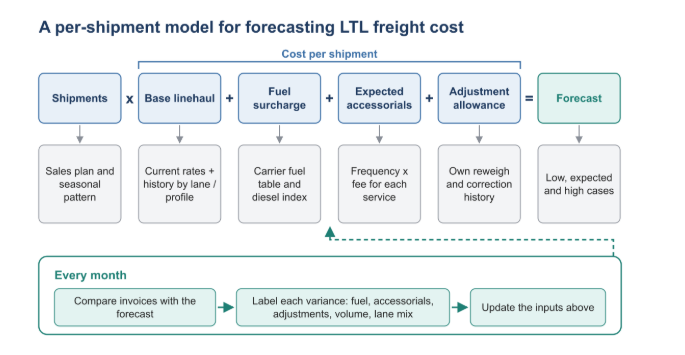
Quick Answer: To forecast freight costs reliably, model each shipment as base linehaul plus fuel surcharge plus expected accessorial charges plus an allowance for adjustments, then multiply by expected volume. Estimate accessorials from how often each service actually appeared on past invoices, not from what quotes listed, and update the model monthly against real invoices.
Freight budgets are often built like a simple rate card: average rate per shipment multiplied by the number of shipments. For less-than-truckload (LTL) freight, that approach tends to undershoot. The invoice that arrives includes a fuel surcharge that moves with diesel prices, plus accessorial charges for services such as tailgate delivery, appointments and waiting time, plus occasional adjustments after a carrier reweighs or re-measures the freight.
Some costs follow recurring patterns; others arise from unpredictable events. Model the regular items and use explicit ranges for uncertain ones. This guide sets out a forecast, a worked example and a monthly reconciliation routine.
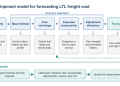
A per-shipment forecast model that prices fuel, expected accessorials and adjustments, then feeds actual invoices back in.
Why Do Freight Forecasts Miss?
Forecasts drift from reality for four recurring reasons:
- Base-rate thinking. The model uses quoted linehaul rates and ignores everything added on top.
- Accessorials treated as exceptions. Services triggered by a customer’s site, such as the lack of a dock, repeat on every shipment to that site.
- Fuel treated as fixed. Carriers commonly reset fuel surcharges on a schedule, so the percentage in January may not apply in June.
- Adjustments ignored. Reweighs, re-measurements and description corrections add cost after the fact.
A Four-Part Model for Each Shipment
Base linehaul
Group invoice history by comparable lane, weight, size and service. Use it to understand shipment mix and past charges, then rebase linehaul against current contract rates or fresh quotes. Historical prices alone may be stale.
Fuel surcharge
Fuel surcharges are usually a percentage of linehaul, set from a table that links a diesel price band to a percentage. The index behind those tables differs by carrier. Some use weekly prices published by Natural Resources Canada, others an industry association’s reported price or a private price survey, and update cycles range from weekly to monthly. Record which index and schedule applies to each carrier you use.
Expected accessorials
For each accessorial service, multiply its expected frequency by the applicable fee, then add the results. Exclude amounts already included in the base price or a bundle, and apply fuel only to the charge categories covered by the carrier’s rule. Frequency comes from your invoices and customer delivery profiles. Fees come from the carrier’s tariff or your agreement.
Adjustment allowance
Set a modest allowance for reweighs, re-measurements and corrections, based on how often they have appeared in your own history. If you have no history yet, start with a placeholder and replace it after a few months of data.
A Worked Example
Illustrative example (hypothetical figures, not real rates or fees): a business expects 40 LTL shipments next month, with an average base linehaul of $350.
| Forecast line | Assumption | Per shipment |
|---|---|---|
| Base linehaul | Assumed current comparable rate | $350.00 |
| Fuel surcharge | 30% of linehaul | $105.00 |
| Tailgate delivery | 25% of shipments at $90 | $22.50 |
| Delivery appointment | 40% of shipments at $60 | $24.00 |
| Residential delivery | 5% of shipments at $95 | $4.75 |
| Waiting time | 10% of shipments at $50 | $5.00 |
| Redelivery | 2% of shipments at $110 | $2.20 |
| Adjustment allowance | 2% of linehaul | $7.00 |
| Total per shipment | $520.45 |
Multiplied by 40 shipments, the forecast is $20,818. A base-only forecast of $350 multiplied by 40 would have shown $14,000, a gap of $6,818 that would otherwise surface as a budget overrun.
Build Ranges, Not a Single Number
Fuel is one variable input worth modelling as a range. In the same hypothetical example, a move in the fuel surcharge from 30 percent to 36 percent raises fuel from $105 to $126 per shipment. Across 40 shipments, that adds $840 to the month. Showing a low, expected and high fuel case gives finance teams a clearer picture than a single total.
Volume and mix deserve ranges too. A new customer without a loading dock can lift the tailgate frequency for the whole account. A seasonal peak can shift the share of shipments needing appointments.
Which Accessorials Belong in the Model?
Include every service that has appeared on your invoices in the past year, plus any your new customers are likely to need. A typical list for LTL shippers covers:
- Tailgate service for sites without a dock or forklift.
- Delivery appointments for receivers that book time slots.
- Residential and limited-access delivery for homes, construction sites, remote rural addresses and congested city areas.
- Inside delivery when freight must go beyond the dock or doorway.
- Waiting time when loading or unloading runs past the carrier’s free allowance.
- Redelivery and storage after a failed attempt or refused delivery.
Each carrier defines these services and their fees in its own tariff, so map your categories to each carrier’s terms.
Where the Frequencies Come From
The most useful data is already in your invoices. Tag every accessorial line by type, then calculate how often each one appears per shipment, by customer and by lane. Customer delivery profiles, which record dock access, receiving hours and appointment rules, let you predict accessorials for new orders before they ship.
Watch for patterns such as:
- Customers who need an appointment on almost every delivery.
- Sites where waiting time appears repeatedly.
- Products that are often re-measured, which points to a packing or recording issue.
Track Variance Every Month
A forecast improves only when it is checked. Compare forecast and actual cost each month and label the source of each difference.
| Variance source | What it signals | Action |
|---|---|---|
| Fuel | Index moved more than assumed | Update the fuel range |
| Accessorial frequency | Customer or site mix changed | Update delivery profiles |
| Adjustments | Measurement differences, rating changes or billing errors | Check evidence and terms; correct records or dispute errors |
| Volume | More or fewer shipments than planned | Revisit sales assumptions |
| Lane mix | Different destinations than planned | Re-segment linehaul history |
Keeping the Data in One Place
Forecasting is easier when quotes, bookings and charges are recorded consistently. For LTL shippers in Quebec and Ontario, Truxweb brings quote comparison, booking and shipment updates into one account, with carrier charges gathered in a combined statement. Confirm which history, invoice and export fields are available before relying on a particular reporting workflow, and check each shipment’s service availability.
Conclusion
A freight forecast that ignores accessorials is really a linehaul forecast. Add fuel as a range, price accessorials by their real frequency, keep an allowance for adjustments, and reconcile against invoices every month. The model stays simple, and the budget stops being surprised by charges that were visible in the data all along.
Frequently Asked Questions
What are accessorial charges?
They are the extra line items a carrier bills when a shipment needs more than a basic pickup and delivery between two docks, such as tailgate service, residential or limited-access delivery, appointments, waiting time, redelivery and storage.
How often do fuel surcharges change?
Schedules vary. Weekly resets are common, monthly averages also exist, and the underlying diesel index differs between carriers, so keep a note of each carrier’s table and update cycle.
Should forecasts use list rates or historical invoices?
Use comparable invoices to estimate shipment mix and service frequency, then apply current contract rates or fresh quotes. Historical charges may be outdated. For a new lane, get current quotes rather than treating a published list rate as the final price.
How large should the adjustment allowance be?
Base it on your own history of reweighs and corrections. There is no universal figure, and good measuring habits should shrink it over time.